Ask a banker at a major tech lender what’s changed in their term sheets since 2021, and you’ll
get a version of the same answer: not much.
That’s the surprising finding at the center of a months-long conversation with lenders at several
of the largest lenders including SVB, Wells Fargo, MUFG, BNP Paribas, and JPMorgan -
practitioners who collectively underwrite billions of dollars in growth-stage deals each year. The
expectation going in was straightforward: AI has upended software, so surely lenders had
responded with new covenants, new protections, new frameworks for a new era. What emerged
instead was more interesting. The term sheet has barely moved. And that, it turns out, is the
story.
Record Volume. Fewer Deals
The numbers, on the surface, look triumphant - two consecutive years of record venture debt
volume. But look past the headline and a counterintuitive picture comes into focus: total dollars
rose while the number of deals fell from 1,168 in 2024 to 943 in 2025. The average deal size
jumped from $52 million to $66 million. Fewer borrowers are getting more money. One deal tells
the story: xAI secured a $5 billion facility through Morgan Stanley in July 2025 (Source: Morgan
Stanley announcement, July 1, 2025), which accounted for approximately 8% of the entire
venture debt market on its own.
FIGURE 1: US VENTURE DEBT - VOLUME & AI SHARE (2021-2025)
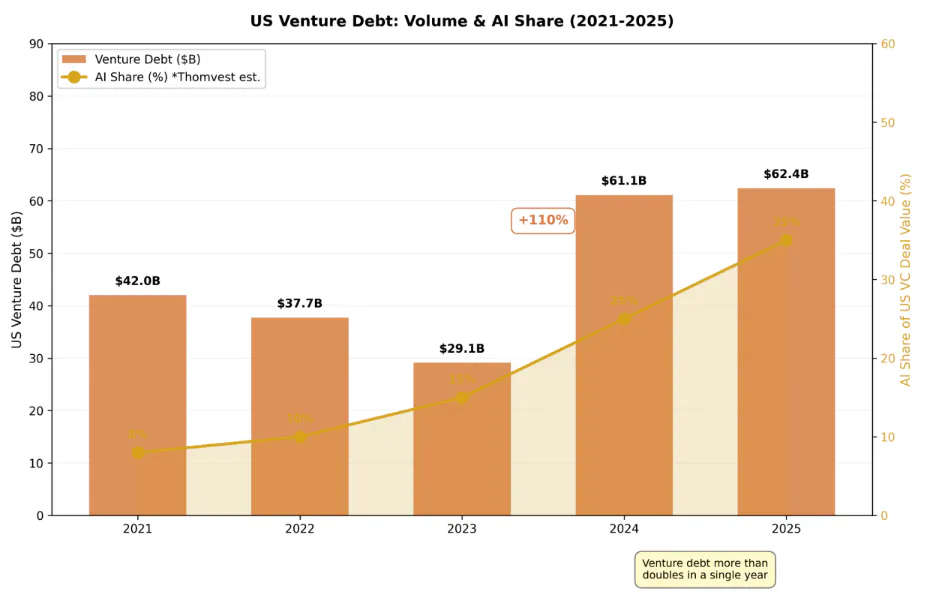
Source: PitchBook-NVCA Venture Monitor Q4 2025 (as of Dec 31, 2025). AI share of venture debt based on Thomvest
Equity capital flooded into AI at an extraordinary rate in 2025, and debt capital followed.
Traditional SaaS companies, many now leaning on credit lines for working capital as equity
investors have paid back their investments, are on the wrong side of that split. The largest
financial institutions in the world - Goldman Sachs alone has a stated goal of growing its private
credit book from $130 billion to $300 billion - are chasing the same top-tier deals, and the deals
they most want tend to be AI companies.
FIGURE 2: AI’S RISING SHARE OF US VC DEAL VALUE (2021-2025)
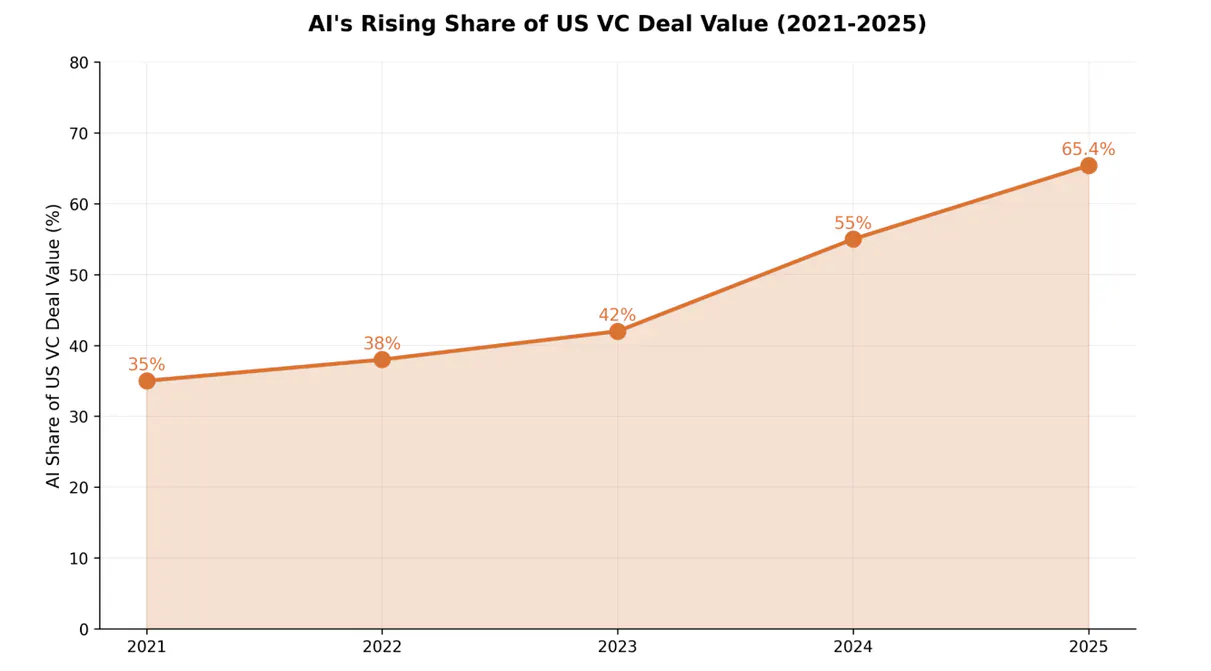
Source: PitchBook-NVCA Venture Monitor Q4 2025. 2025: AI = 65.4% of US VC deal value ($222B of $339B total). Intermediate year values estimated based on reported trends.
And yet the term sheets that lenders are issuing looks almost unchanged. Negative liens on IP,
no financial covenants at the early stage, mandatory banking relationships; the mechanics are
the same as they were in 2021. Warrants have declined sharply at the competitive late-stage
end of the market, though they remain standard for early-stage deals where investor-dependent
underwriting is the norm. Mitratech’s $2B+ unitranche, led by Blackstone and Antares, priced at
S+475 with no maintenance covenants. In a market where cov-lite has become the standard for
outstanding US leveraged loans, that isn’t a concession. It's the baseline.
The Metric That’s Quietly Breaking
Strip away the deal volume and the headline spreads, and what you find underneath is a more
uncomfortable story: the foundational metric that venture lending has been built on for a decade
is starting to crack.
ARR (annual recurring revenue) has been the bedrock of growth-stage lending. A dollar of ARR
from a two-year enterprise contract, with strong net dollar retention, is a reliable proxy for future
cash flow. The entire underwriting playbook was built around that assumption: size the loan as a
multiple of ARR, set covenant triggers to ARR, price the deal based on ARR quality. It worked
because SaaS revenue was genuinely predictable. AI revenue often isn’t.
TABLE 1: AI-NATIVE VS. CLASSIC SAAS - KEY CREDIT METRICS
| Metric | Classic SaaS | AI-Native |
|---|---|---|
| Net Dollar Retention | ~106–108% median; enterprise tiers 115%+ | 120%+ for $100K+ ACV enterprise; ~80% for $50K ACV cohorts - below breakeven threshold |
| First-Year Churn | Low single digits for growth-stage companies | ~30% in AI-native portfolios; up to 50%+ in lower-ACV / conversational AI tiers |
| Contract Length | Multi-year enterprise; month-to-month SMB | Skewing shorter; consumption and outcomes-based models spreading quickly |
| Revenue Repeatability | High - core lending assumption | Variable; one-time and non-repeatable revenue commonly mixed into reported ARR |
Sources: SaaS NDR benchmarks:Primary research; Blossom Street Ventures Q2 2025. AI-native churn: ChartMogul “The AI
Churn Wave”; LiveX AI 2025 Benchmarks ;Thomvest primary research 2026.
The gaps in that table aren’t just operational footnotes, they’re credit risk. Lenders with AI-heavy
portfolios are seeing net dollar retention above 120% for enterprise customers at $100K+
ACV - and roughly 80% for the same product’s $50K cohort (Source:Thomvest primary research
2025), which sits below the breakeven threshold that makes a loan safe to underwrite. First-year
churn is running around 30% in AI-native portfolios, compared to low single digits in mature
SaaS. Some portfolio companies have shifted a meaningful share of bookings to
consumption-based models within 18 months of launch. The revenue line doesn’t look the same
six months in as it did on the day the loan closed.
So what counts as ARR for an AI company? Ask the lenders, and you get some version of:
we’re still working on it. Every institution we spoke with is running AI companies through the
same risk models built for SaaS, with underwriters expected to use judgment where the
numbers don’t fit. In practice, that judgment means layering on new factors (such as GPU
capacity, capex intensity, switching costs, dependency on a specific foundation model)
alongside traditional ARR and retention metrics. The question “why are they sticky?” carries
more weight than it used to. But these are overlays, not a new framework, and the result is that
many AI companies are coming in rated “special mention” or “substandard” under existing
models - not because the growth story is weak, but because the path to profitability isn’t fully
funded. No one has published anything better. The category is too new, the data too thin, the
range of outcomes too wide.
The pressure is showing up in returns. Private debt’s rolling one-year IRR fell to 3.9% in H1
2025 - its weakest reading since 2020. In the leveraged loan market, secondary prices on
software loans fell by 756 basis points since year-end 2025, compared with just 124 basis
points for non-software credits. Infrastructure debt, powered by datacenter financing, is the
outlier at 7.5%(Source: Pitchbook 2025 Annual Global Private debt report). The market is
reallocating toward hard assets and away from the recurring software revenue that used to be
the safest thing in the room.
When the Servers Are the Collateral
While underwriters argue about what to do with AI revenue, a different kind of innovation has
taken hold on the collateral side. It’s more tangible than anything happening in the term sheet;
the structures below have moved from exotic to standard remarkably fast.
The Term Sheet That Didn’t Change
(And Why That’s the Story)
Thomvest Ventures • May 2026
Ask a banker at a major tech lender what’s changed in their term sheets since 2021, and you’ll get a version of the same answer: not much.
That’s the surprising finding at the center of a months-long conversation with lenders at several of the largest lenders including SVB, Wells Fargo, MUFG, BNP Paribas, and JPMorgan - practitioners who collectively underwrite billions of dollars in growth-stage deals each year. The expectation going in was straightforward: AI has upended software, so surely lenders had responded with new covenants, new protections, new frameworks for a new era. What emerged instead was more interesting. The term sheet has barely moved. And that, it turns out, is the story.
Record Volume. Fewer Deals
The numbers, on the surface, look triumphant - two consecutive years of record venture debt volume. But look past the headline and a counterintuitive picture comes into focus: total dollars rose while the number of deals fell from 1,168 in 2024 to 943 in 2025. The average deal size jumped from $52 million to $66 million. Fewer borrowers are getting more money. One deal tells the story: xAI secured a $5 billion facility through Morgan Stanley in July 2025 (Source: Morgan Stanley announcement, July 1, 2025), which accounted for approximately 8% of the entire venture debt market on its own.
FIGURE 1: US VENTURE DEBT - VOLUME & AI SHARE (2021-2025)
Source: PitchBook-NVCA Venture Monitor Q4 2025 (as of Dec 31, 2025). AI share of venture debt based on Thomvest primary research.
Equity capital flooded into AI at an extraordinary rate in 2025, and debt capital followed. Traditional SaaS companies, many now leaning on credit lines for working capital as equity investors have paid back their investments, are on the wrong side of that split. The largest financial institutions in the world - Goldman Sachs alone has a stated goal of growing its private credit book from $130 billion to $300 billion - are chasing the same top-tier deals, and the deals they most want tend to be AI companies.
FIGURE 2: AI’S RISING SHARE OF US VC DEAL VALUE (2021-2025)
Source: PitchBook-NVCA Venture Monitor Q4 2025. 2025: AI = 65.4% of US VC deal value ($222B of $339B total). Intermediate year values estimated based on reported trends.
And yet the term sheets that lenders are issuing looks almost unchanged. Negative liens on IP, no financial covenants at the early stage, mandatory banking relationships; the mechanics are the same as they were in 2021. Warrants have declined sharply at the competitive late-stage end of the market, though they remain standard for early-stage deals where investor-dependent underwriting is the norm. Mitratech’s $2B+ unitranche, led by Blackstone and Antares, priced at S+475 with no maintenance covenants. In a market where cov-lite has become the standard for outstanding US leveraged loans, that isn’t a concession. It's the baseline.
The Metric That’s Quietly Breaking
Strip away the deal volume and the headline spreads, and what you find underneath is a more uncomfortable story: the foundational metric that venture lending has been built on for a decade is starting to crack.
ARR (annual recurring revenue) has been the bedrock of growth-stage lending. A dollar of ARR from a two-year enterprise contract, with strong net dollar retention, is a reliable proxy for future cash flow. The entire underwriting playbook was built around that assumption: size the loan as a multiple of ARR, set covenant triggers to ARR, price the deal based on ARR quality. It worked because SaaS revenue was genuinely predictable. AI revenue often isn’t.
TABLE 1: AI-NATIVE VS. CLASSIC SAAS - KEY CREDIT METRICS
Metric
Classic SaaS
AI-Native
Net Dollar Retention
~106–108% median; enterprise tiers 115%+
120%+ for $100K+ ACV enterprise; ~80% for $50K ACV cohorts - below breakeven threshold
First-Year Churn
Low single digits for growth-stage companies
~30% in AI-native portfolios; up to 50%+ in lower-ACV / conversational AI tiers
Contract Length
Multi-year enterprise; month-to-month SMB
Skewing shorter; consumption and outcomes-based models spreading quickly
Revenue Repeatability
High - core lending assumption
Variable; one-time and non-repeatable revenue commonly mixed into reported ARR
Sources: SaaS NDR benchmarks:Primary research; Blossom Street Ventures Q2 2025. AI-native churn: ChartMogul “The AI Churn Wave”; LiveX AI 2025 Benchmarks ;Thomvest primary research 2026.
The gaps in that table aren’t just operational footnotes, they’re credit risk. Lenders with AI-heavy portfolios are seeing net dollar retention above 120% for enterprise customers at $100K+ ACV - and roughly 80% for the same product’s $50K cohort (Source:Thomvest primary research 2025), which sits below the breakeven threshold that makes a loan safe to underwrite. First-year churn is running around 30% in AI-native portfolios, compared to low single digits in mature SaaS. Some portfolio companies have shifted a meaningful share of bookings to consumption-based models within 18 months of launch. The revenue line doesn’t look the same six months in as it did on the day the loan closed.
So what counts as ARR for an AI company? Ask the lenders, and you get some version of: we’re still working on it. Every institution we spoke with is running AI companies through the same risk models built for SaaS, with underwriters expected to use judgment where the numbers don’t fit. In practice, that judgment means layering on new factors (such as GPU capacity, capex intensity, switching costs, dependency on a specific foundation model) alongside traditional ARR and retention metrics. The question “why are they sticky?” carries more weight than it used to. But these are overlays, not a new framework, and the result is that many AI companies are coming in rated “special mention” or “substandard” under existing models - not because the growth story is weak, but because the path to profitability isn’t fully funded. No one has published anything better. The category is too new, the data too thin, the range of outcomes too wide.
The pressure is showing up in returns. Private debt’s rolling one-year IRR fell to 3.9% in H1 2025 - its weakest reading since 2020. In the leveraged loan market, secondary prices on software loans fell by 756 basis points since year-end 2025, compared with just 124 basis points for non-software credits. Infrastructure debt, powered by datacenter financing, is the outlier at 7.5%(Source: Pitchbook 2025 Annual Global Private debt report). The market is reallocating toward hard assets and away from the recurring software revenue that used to be the safest thing in the room.
When the Servers Are the Collateral
While underwriters argue about what to do with AI revenue, a different kind of innovation has taken hold on the collateral side. It’s more tangible than anything happening in the term sheet; the structures below have moved from exotic to standard remarkably fast.
TABLE 2: EMERGING DEAL STRUCTURES IN AI & TECH LENDING
Structure
Typical Borrower
Key Terms / Features
Example
Unitranche (Cov-Lite)
PE-backed software, mid-market
Single lender or club; S+375–550; no maintenance covenants; increasingly sub-S+500 in 2025
Mitratech $2B+ @ S+475 (Blackstone / Antares, Dec 2025)
GPU-Backed / SPV Lease
AI compute-intensive companies
GPUs pledged as hard-asset collateral; advance rates 50–70%; debt kept off B/S via SPV
Lambda Labs $500M; CoreWeave ~$8B GPU-backed debt; BlackRock, PIMCO, Carlyle all active
First-Out / Last-Out
Large-cap, bank + private credit syndicate
Bank first-out ~S+300–400; PC last-out ~S+650–800; blended ~S+500; intercreditor agreement governs waterfall
CoreWeave-type capital stacks
Datacenter Project Finance
Hyperscaler infrastructure operators
Hyperscaler offtake agreement transfers credit risk to anchor; rated like the anchor, not the operator
CoreWeave / OpenAI offtake; Meta / Blue Owl $27B arrangement
AI Training Tranche
Frontier AI model companies
Interest-only 12–24 months; matched to front-loaded capex before revenue ramps
Emerging structure; discussed by multiple lenders (2025+)
Sources: Mitratech deal: Bloomberg / IFR / Private Equity Wire, Dec 2025. GPU-backed lending: PitchBook (“As venture debt gambles on GPUs”); Two Birds legal analysis 2025; Lambda Labs / CoreWeave public filings. First-Out/Last-Out spreads: Thomvest primary lender interviews. Datacenter project finance: CoreWeave IR (Jul 2025); Global Data Center Hub (Meta / Blue Owl). AI training tranche: Thomvest primary lender interviews.
Across these structures, a few patterns hold. Maintenance covenants are largely absent, and lenders are relying on structural protections and collateral quality rather than financial triggers. Creative collateral is doing more of the underwriting work: GPUs, offtake agreements, and hyperscaler commitments are replacing ARR as the primary credit anchor. Capital stacks are getting more layered, with first-out/last-out arrangements and SPVs becoming standard features of larger deals rather than exceptions.
FIGURE 3: TECH LENDING LANDSCAPE
Source: Deal information pulled from Pitchbook
Venture lenders - SVB, Western Alliance, Hercules, TriplePoint - are the earliest relationships for VC-backed companies. SVB alone banked 50% of all US VC-backed tech and healthcare companies that went public in 2024. Large commercial banks - JPMorgan, Wells Fargo, MUFG, BNP Paribas - come in at the growth and pre-IPO stage, with the banking relationship (deposits, treasury management) as their structural lever. Private credit - Blackstone, Blue Owl, Ares, Antares - dominates large unitranche and direct lending for PE-backed companies. At the top of the stack, institutional lenders (BlackRock, PIMCO, Apollo) and investment banks (Goldman, Morgan Stanley) handle the structurally complex megadeals - GPU-backed facilities, datacenter project finance, and ABS anchored by hyperscaler offtake agreements.
What the Term Sheet Will Eventually Say
Credit documentation is a lagging indicator, but the direction of travel is legible. Expect IP clauses in AI deals to get more specific - particularly around model weights, training data provenance, and what happens to those assets if a company restructures. The covenant shift is already underway: Wells Fargo Private Credit structures facilities with ARR-based covenants for the first two to three years, converting to leverage-based metrics as the company matures; MUFG builds mandatory cash flow covenant flips into five-year deals, requiring companies to demonstrate a credible path to profitability by mid-term (Source: Thomvest primary research). At the early stage, milestone-based tranching (with capital released in stages tied to operating targets rather than drawn at close) is beginning to replace the single-draw structure. None of these mechanisms show up in headline term sheet comparisons, but they represent a meaningful tightening of the effective performance bar. Intercreditor agreements will continue to grow more complex as capital stacks expand. GPU-backed facilities, still considered exotic by many lenders, will become routine for any company with significant compute infrastructure.
The venture term sheet has always been a statement of confidence. The fact that it hasn’t changed - even as AI reshapes the revenue, the retention, and the competitive dynamics of every company underneath it - is the most interesting signal in the market right now. Either lenders have correctly concluded that the underlying credit quality is fine and the old frameworks still hold. Or the term sheet is the last thing to move in a credit cycle that’s already turning. Nobody knows yet which one it is.
Sources
Primary Research: Thomvest Ventures lender interviews - the majority of the top 10 lenders in the US market. Burn and retention figures reflect primary interview research and are not independently verified by PitchBook.
Market Data (Venture): PitchBook-NVCA Venture Monitor Q4 2025 (as of December 31, 2025); PitchBook 2025 Annual Global Private Debt Report; PitchBook 2024-2025 Venture Debt Review.
Deal Data: CoreWeave IR / Business Wire, July 31, 2025; Goldman Sachs press releases (October 2025, Q1 2026); Morgan Stanley press release July 2025; Pitchbook Mitratech credit news (January 2026).
Industry Data: GARP “Covenant Lite and Investor Risk in Leveraged Loans”; Latham & Watkins Lending & Secured Finance 2025; Dallas Fed “Evolving Leveraged Loan Covenants” (August 2024); Menlo Ventures “2025 State of Generative AI in the Enterprise” (December 2025).
General: Bloomberg; Fortune; Crunchbase; CNBC.